You've probably been there this week. The organiser wants “final” numbers, the kitchen wants production counts, the banqueting team wants staffing, and the guest list still lives across inboxes, spreadsheets, ticketing exports and half-complete dietary notes.
That's when forecasting breaks down. Not because catering is unpredictable, but because the data is fragmented. Most overproduction starts long before service. It starts when teams rely on guarantees, gut feel and last-minute chase emails instead of building one clean view of who's attending, what they've chosen and what similar events consumed.
If you want to learn how to forecast event catering needs using guest data, the answer isn't a clever formula on its own. It's an operating method. You collect the right guest signals early, shape them against real attendance behaviour, convert them into menu-level demand, and then carry that data all the way into chef reports, run sheets and post-event review.
Table of Contents
- Beyond the Guesswork in Event Catering
- Building Your Foundation with Structured Guest Data
- Modelling Attendance and Consumption Patterns
- Drilling Down into Menu and Dietary Specifics
- Automating Accuracy with Integrated Event Software
- From Reactive Planning to Proactive Profitability
Beyond the Guesswork in Event Catering
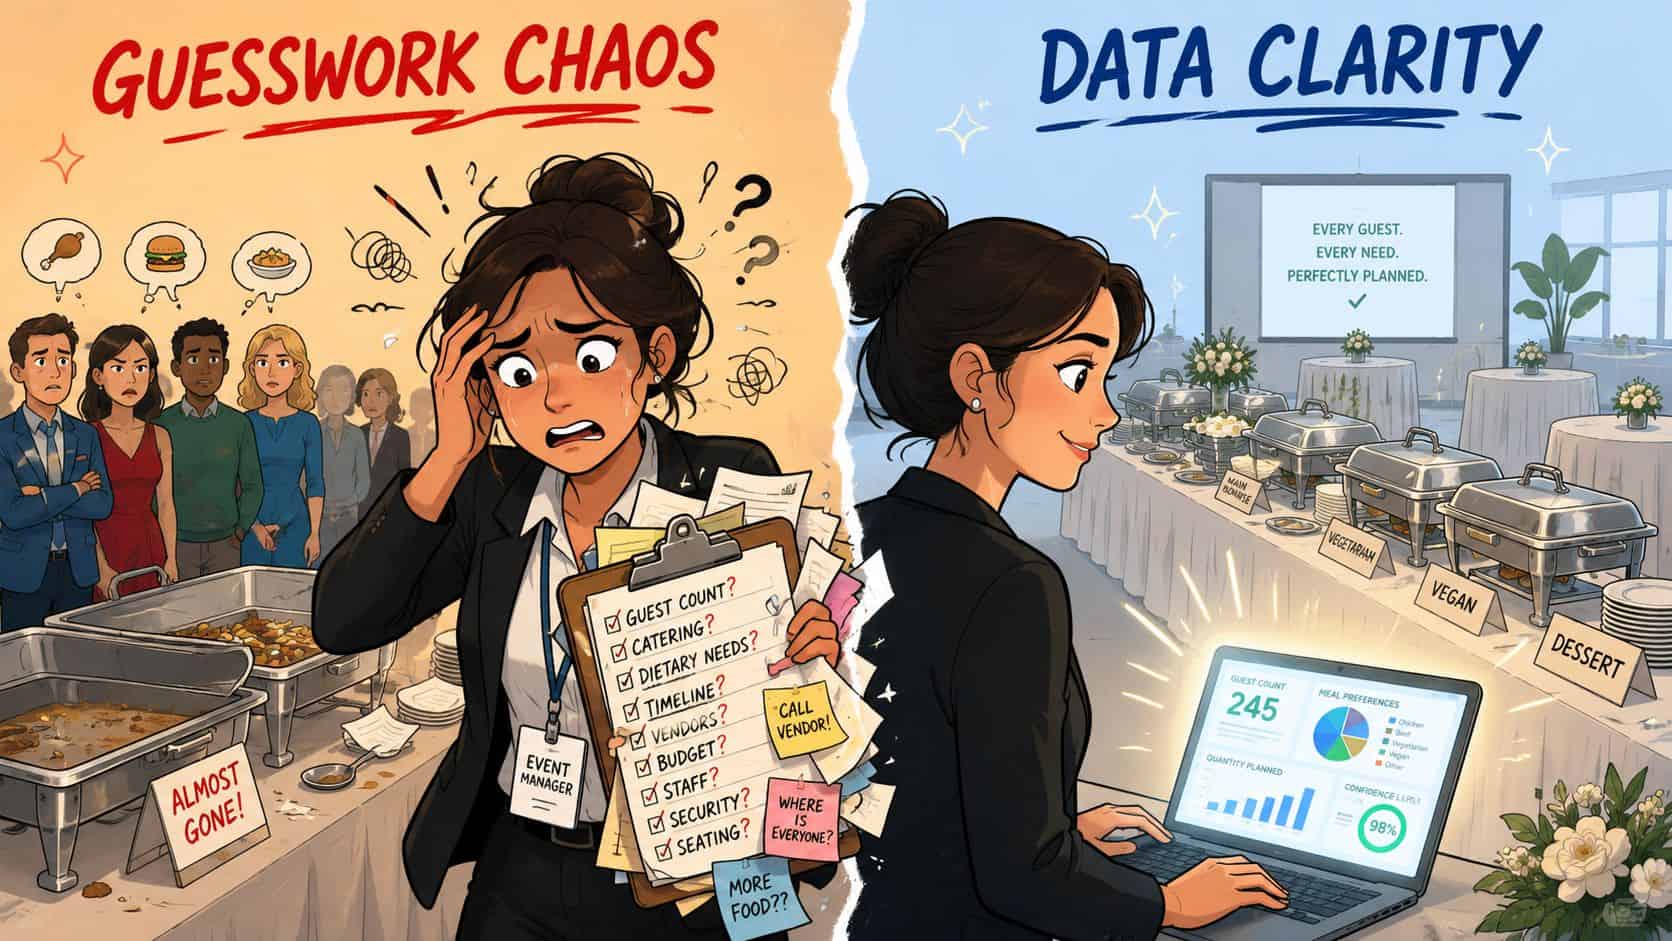
A typical event week often looks calm on paper and chaotic in practice. Sales has a number. The organiser has a different number. The kitchen is working from a menu split that was updated yesterday. Front of house still isn't sure how many vegan mains to hold back. None of this feels unusual because most venues have normalised the scramble.
Why final numbers always feel unstable
A key issue isn't that guests are impossible to predict. It's that many teams are forecasting from the wrong starting point. They use the guarantee as if it were attendance. They count dietary requests as admin notes instead of demand signals. They review covers at total-event level but never ask which dishes are likely to be accepted, refused, swapped or left untouched.
That creates avoidable tension between departments. Chef teams hedge with extra production. Event managers keep chasing updates because they don't trust the list in front of them. Procurement orders broad safety stock because nobody can defend the item-level forecast with confidence.
Practical rule: If the kitchen receives a different version of the truth than the events team, the forecast has already failed.
Manual forecasting also hides risk until the last moment. The list might say 180 expected guests, but if attendance history for that event type runs below the headline number, you've built labour, mise en place and purchasing around optimism rather than probability.
What good forecasting changes operationally
A data-led forecast changes the conversation. Instead of asking, “What do we think will happen?”, the team asks, “What does the guest data show, and what does similar history tell us to prepare?” That shift matters because it improves three things at once.
- Food production becomes tighter: The kitchen prepares for likely consumption, not just guaranteed headcount.
- Staffing gets calmer: Banqueting and service leaders can roster against realistic covers and service style.
- Waste becomes visible: Surplus isn't written off as “one of those events”. It's traced back to a forecasting assumption.
There's also a practical emotional benefit. Teams work better when the number they're planning around is defensible. You can explain why you're holding a second tier of stock, why one dish is capped, or why a dietary plate count has changed. That reduces last-minute debates and improves execution.
Good forecasting doesn't remove uncertainty. It puts it in the right place. You still build contingency, but you do it deliberately.
Building Your Foundation with Structured Guest Data
The quality of your forecast is set before any calculation happens. If your guest data sits in email threads, spreadsheet tabs and handwritten service notes, you're not forecasting. You're reconciling conflicting records under time pressure.
Start with one source of truth
Every event needs one structured record that combines guest identity, attendance status, menu choices, dietary needs, drinks selections and table assignment. The form can vary by venue, but the principle doesn't. One event, one dataset, one operational version of the truth.
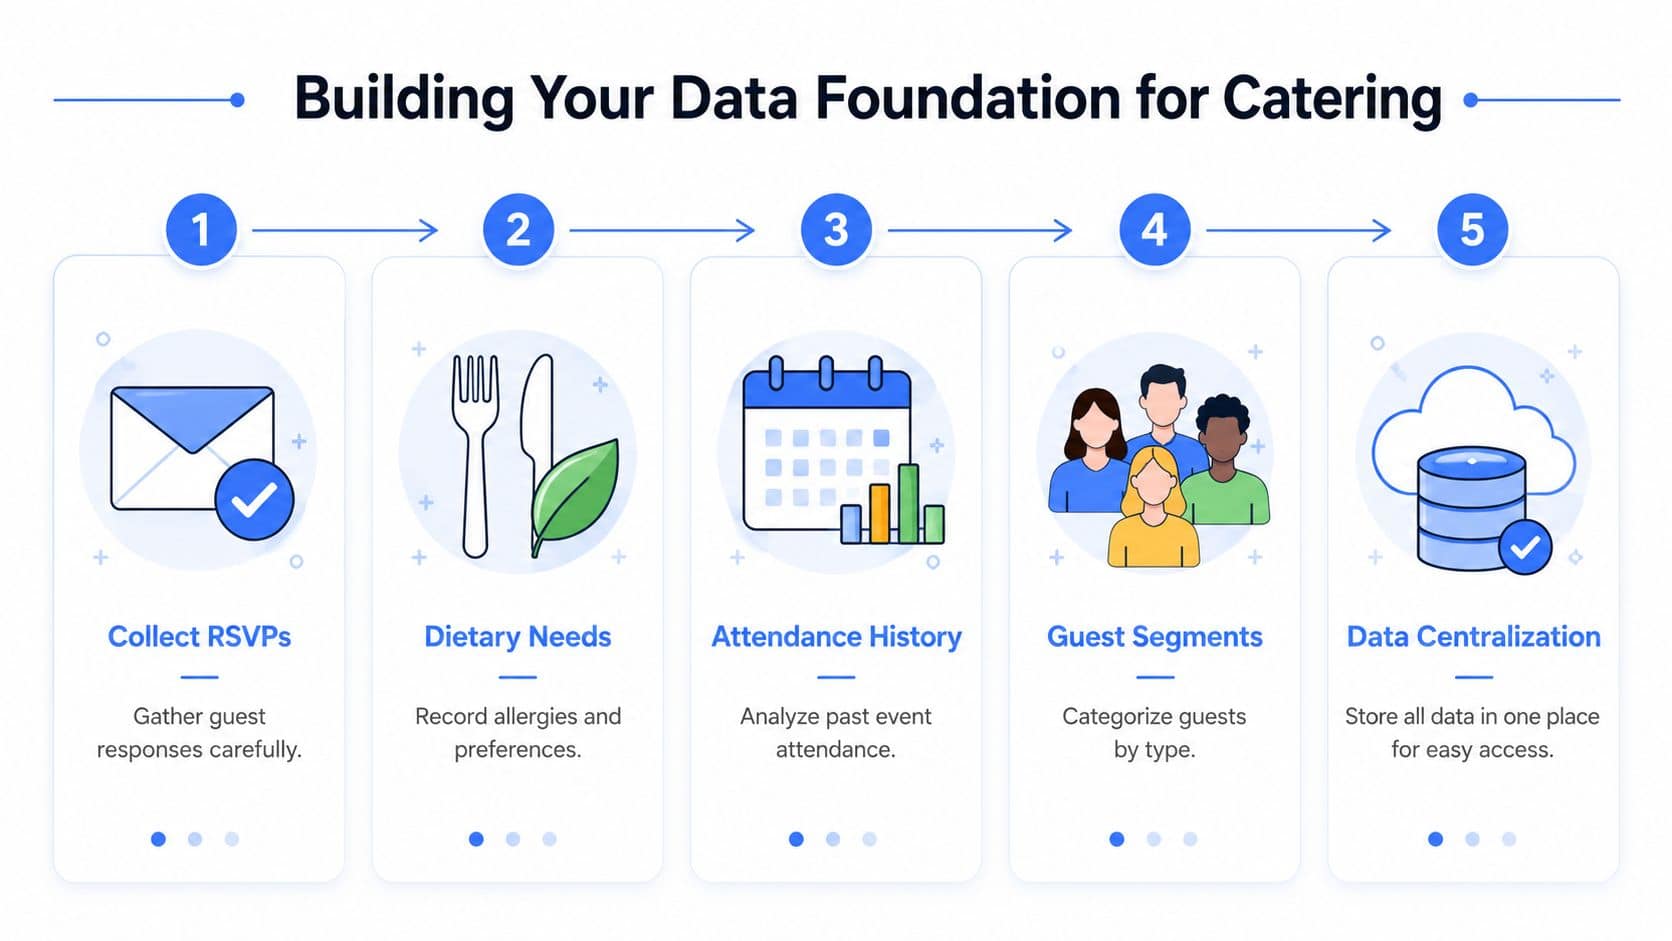
If you split these records across departments, forecasting gets distorted fast. Dietary requests get captured late. Seating changes don't flow back into menu reports. Last-minute substitutions never make it to the kitchen sheet. A clean setup links each guest to each operational requirement, including seating plans linked to pre-orders, so changes move through the event properly.
What data to collect before you forecast
The strongest forecasts use both historical behaviour and live guest input. In the UK hospitality sector, accurate event catering forecasting relies on analysing at least 12 to 18 months of historical POS sales data to identify seasonal patterns and trend shifts, which gives you a credible baseline before you layer event-specific demand on top of it, as outlined in this demand planning guidance for hospitality.
That baseline matters because event demand isn't flat. You need to know whether similar functions over-index at weekends, whether festive lunches behave differently from private dinners, and whether a venue's own patterns shift during local events, school holidays or quieter trading windows.
For live event forecasting, capture these inputs early:
- Confirmed RSVPs: Not just who was invited, but who has actively responded.
- Guest-level food choices: A menu split by person is more useful than a top-line headcount.
- Dietary and allergen data: This should be structured by guest, not buried in free text.
- Ticketing or booking pace: The rate of sign-up often tells you more than a static list.
- Event type and audience mix: Corporate dinner, public ticketed event, gala and festive party all behave differently.
Clean data beats more data
The problem isn't a shortage of information. It's a shortage of usable information. If your data includes voids, duplicates, stale RSVPs, merged plus-ones or unverified dietaries, your forecast will look precise and still be wrong.
A simple review process helps:
| Check | What to fix | Why it matters |
|---|---|---|
| Guest status | Remove duplicates and unresolved placeholders | Stops inflated covers |
| Menu choice | Standardise dish naming | Prevents split-report errors |
| Dietary fields | Separate allergens from preferences | Avoids overproducing specialist plates |
| Attendance history | Group by event type | Gives a usable show-up pattern |
Structured guest data isn't admin overhead. It's the raw material for production planning.
This is the point many venues skip. They chase more responses but never improve the shape of the data they already have. Forecasting gets better when the records are clean enough for chefs, banqueting managers and event coordinators to use the same numbers with confidence.
Modelling Attendance and Consumption Patterns
Once the dataset is clean, the next job is to stop treating all guest counts as equal. A registration list, a guarantee, an RSVP count and actual turnout are not the same number, and building production from the wrong one is where waste usually starts.
Turn RSVP volume into realistic covers
UK event catering data shows that actual attendee turnout typically ranges between 50% and 70% of the initial pre-registration or RSVP count, and venues using accurate pre-ordering systems can reduce kitchen waste by up to 20% by aligning production with precise guest data, according to this event guest count guide.
That's why the first modelling step is to separate interest from attendance. A large RSVP list can still produce a modest room. Public events often carry more volatility than closed private functions. Corporate events can behave differently again depending on travel, agenda density and internal sign-off.
A useful working model combines:
- historical turnout for that event type
- the current RSVP pattern
- the firmness of the booking source
- any known drop-off signals such as broad guest lists with weak confirmation behaviour
If you also sell tickets, the quality of forecasting improves when you read booking pace and conversion signals together. In this context, a tighter event ticketing strategy gives operations a better attendance view than a single headline number.
Use simple models the team can trust
You don't need an opaque model to get better results. One of the most practical methods is a 4-week rolling average, calculated as (Week1 + Week2 + Week3 + Week4) / 4, to smooth short-term noise before applying event-specific adjustments. Guidance for hospitality forecasting also recommends a 20% safety buffer for high-uncertainty events and notes that local festivals or school holidays can shift demand by up to 8% if you ignore them, as described in this restaurant demand forecasting resource.
That gives you a reliable process:
- Start with the baseline: What do similar events usually deliver?
- Smooth recent volatility: Use the rolling average so one unusual week doesn't dominate.
- Adjust for event context: School holidays, local fixtures, weather-sensitive formats and audience profile all matter.
- Apply a deliberate buffer: Only where uncertainty justifies it.
For kitchens, this is far more useful than a flat uplift on every item.
If you're working out portion requirements for a plated or buffet menu, commodity planning still matters at ingredient level. A practical reference can help you determine beef quantities for catering once your cover forecast is solid enough to trust.
Build buffers by production tier, not panic
The smartest buffer isn't one large overproduction decision. It's a tiered production plan. Produce the base confidently, then hold a second tier of ingredients or partially prepared items that can be finished quickly if turnout lands high.
Produce for the likely room, not the loudest estimate.
That approach protects service without locking all your cost into speculative covers. It also gives chefs more control over perishables, especially where garnish, specialist sides or dietary alternatives are expensive to overproduce. The forecast becomes something the kitchen can execute, rather than a number everyone privately questions.
Drilling Down into Menu and Dietary Specifics
Forecasting total covers is only half the job. Kitchens don't cook covers. They cook dishes, variants, accompaniments and dietary-safe alternatives. If your forecast stops at headcount, the team still has to guess the menu mix.
Forecast dishes, not just covers
Guest-level pre-orders solve the biggest blind spot in event catering. They show demand by course, by dish and by service point before the event starts. That lets the kitchen order and prep against likely uptake instead of broad menu assumptions.
This is particularly useful when one option consistently attracts stronger demand than the others. A set menu with three mains rarely lands evenly. Without guest choices, chefs tend to hedge across all options. That means more stock held, more unfinished mise en place and more spoilage risk after service.
A better working split usually includes:
- Main course choice by guest: Useful for protein ordering and batch planning.
- Starter and dessert take-up: Important where courses are optional or have lower conversion.
- Service-style variation: Plated, buffet, bowl food and stations need different forecasting logic.
- By-table or by-wave timing: Helps with pass control and hot-hold pressure.
Treat allergens as a forecasting variable
This is a critical oversight. While allergen data is collected for compliance, it is often not incorporated into the demand forecast. That's a mistake. A critical and often omitted forecasting variable is allergen-specific waste. UK Food Standards Agency reporting suggests 20% of catering waste can stem from unclaimed allergen-safe plates left unused due to fragmented allergen tracking, as discussed in this guide on guest count and catering planning.
That changes how you should handle specialist meals. Don't treat them as a side list. Forecast them the same way you forecast core menu demand, with named guests, confirmed attendance status and final production timing. If your team can collect allergens automatically, that information becomes operationally useful instead of sitting in disconnected notes.
Here's the practical difference:
| Weak process | Strong process |
|---|---|
| “Need 12 allergen meals” | “Need named plates for confirmed guests by table and course” |
| Free-text dietary notes | Structured allergen fields |
| Specialist meals produced too early | Final counts reviewed close to service |
| Waste reviewed as generic surplus | Waste traced to allergen-specific overproduction |
The expensive plate isn't always the hardest one to cook. It's often the one prepared correctly for a guest who never arrives.
Use drink selections to forecast stock and spend
Beverage forecasting improves for the same reason food forecasting does. Pre-event guest choices remove ambiguity. You're no longer ordering bar stock based only on package assumptions or broad event history. You can see likely demand before the room opens.
That matters operationally and commercially. When guests pre-order drinks, the venue can plan glassware, chilling, bar setup and stock depth far more accurately. It also sharpens upsell visibility. A drinks list chosen in advance is easier to convert into a stock and service plan than a vague expectation of what “this crowd usually drinks”.
Automating Accuracy with Integrated Event Software
Manual methods can work. They just stop working gracefully when event volume increases, guest counts rise, or the brief changes repeatedly in the final days. The problem isn't effort. It's the number of handoffs.
Where manual workflows fail
Most event teams still patch the process together. Sales confirms the function. Events chases selections. F&B updates a spreadsheet. The kitchen gets a revised count. Front of house adjusts seating. Then another batch of responses arrives and the cycle starts again.
This creates two problems. First, data decays every time someone rekeys it. Second, forecasting and execution drift apart. The number used to order food isn't always the number used for place cards, function sheets or final service planning.
That gap matters more as events get larger or more complex. Guest substitutions, dietaries, drinks choices and table moves all have to flow through the same operational chain. If they don't, the forecast might look right while the event still runs wrong.
What an integrated workflow fixes
A dedicated event platform changes forecasting because it improves the data at source. Guest communications are structured, responses are centralised, and production outputs are generated from the same dataset the team has been planning from.
Using a dedicated platform for pre-orders achieves a 99.2% guest response rate, providing near-complete forecasting data, and one hotel reported a 251% uplift in wet spend from drink pre-orders, according to Creventa's features overview.
That matters because better response rates don't just make life easier for the events office. They tighten the accuracy of menu splits, dietary counts, beverage planning and staffing assumptions. Instead of estimating from partial returns, the team works from a much fuller guest picture.
Integrated systems also reduce friction between commercial and operational teams. Booking data can flow into planning, and planning can flow into execution. For venues that need connected operations, event software integrations matter because they remove re-entry and keep the event record consistent across the process.
A stronger workflow usually gives you all of this in one chain:
- Pre-orders captured by guest: Food and drinks demand becomes visible early.
- Dietary data held structurally: Chefs get usable reports, not messy notes.
- Seating linked to selections: Front of house and kitchen work from the same guest record.
- Instant function documents: Run sheets, kitchen sheets and place cards reflect current data, not yesterday's export.
The second part of the workflow is worth seeing in context:
The operational payoff
When forecasting is built into the event workflow, teams stop treating admin and operations as separate jobs. The guest response becomes the production signal. The production signal becomes the run sheet. That's what removes last-minute manual reconciliation.
Creventa was founded in June 2020 by Luke Ireland and Andrew Norton. The platform supports events from 4 to over 2,500 guests and includes a core platform for pre-orders, allergens, seating, place cards and reports, plus Creventa Flow for enquiries, proposals and quotes, Prinq for guests to order and pay before events, and post-event feedback and guest insights, as outlined on Creventa's website.
There's a reason this matters in kitchens. A global hotel chain has reported around 20% less food waste from more accurate pre-ordering, and the workflow becomes especially powerful when guest-level allergen and dietary data flows directly into kitchen-ready reports rather than being manually stitched together. That's where forecasting stops being theoretical and starts affecting margin, labour pressure and service quality on the day.
From Reactive Planning to Proactive Profitability
The strongest catering forecasts don't come from one clever spreadsheet. They come from a disciplined chain. Clean guest data, realistic attendance modelling, menu-level demand planning, allergen-specific control and then operational documents generated from the same record.
The method that holds up under pressure
If you strip it back, the process is straightforward:
- Build the baseline: Use your historical trading and event history.
- Capture live guest intent: RSVPs, dish choices, drinks and dietary details.
- Forecast in layers: Covers first, then menu splits, then specialist requirements.
- Review the outcome: Compare production, consumption and waste after the event.
That final step is where teams improve fastest. Waste review shouldn't stop at “too much food left over”. It should show which assumptions failed. Was turnout softer than expected? Did one menu option underperform? Were allergen-safe meals prepared for guests who didn't arrive? This is the power of data and intelligence in practice. Not dashboards for their own sake, but clearer decisions next time.
Why this becomes a commercial advantage
Forecasting well protects margin, but it also frees up people. When the process is tighter, chefs spend less time second-guessing counts, event managers spend less time chasing fragmented updates, and service teams walk into the room with cleaner plans.
That makes the business more profitable in a way that's easy to miss. Better forecasting lowers waste, improves stock confidence, reduces avoidable stress and supports more accurate menu costing. If you want to sharpen that side of planning, it helps to review how you calculate the cost of food alongside your forecasting process.
Teams that still run events through spreadsheets and email can absolutely improve from where they are. But once guest data becomes structured and operational, forecasting stops being a recurring fire drill. It becomes part of how the venue runs smarter.
If you want a practical way to centralise guest data, collect pre-orders, manage allergens, generate kitchen reports and run events with less waste, take a look at Creventa.
James Nixon, Product, Creventa. James works on the Creventa platform, including guest pre-ordering, seating plans, ticketing and the reports venues rely on during service.